Free Template
Setting Up a P6 S-Curve Report in Excel

What’s Inside?
Create Primavera P6 S-Curve Reports in Excel.
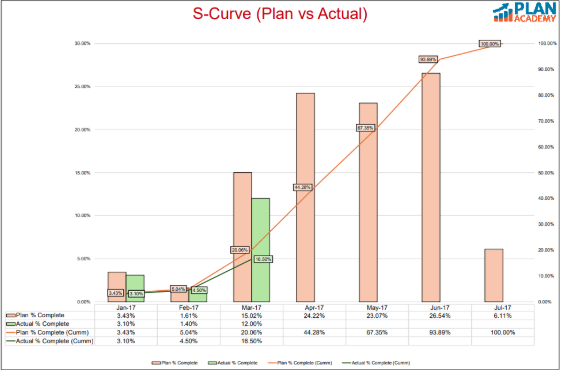
The YouTube tutorial below and template outline the use of the S-curve and how it can be utilized to track progress in relation to the budgeted cost or man-hours.
The S-curve is a project management tool used to visualize the cumulative progress of a project over time. By plotting the planned, actual, and forecasted progress of key project parameters, such as budgeted costs or man-hours, project managers can monitor the project’s performance.
Take your skills to the next level by bringing in Excel.
