Free Webinar
Linear Scheduling for Major Infrastructure Projects
Info:
If you'd like to watch the recording, fill in the form on the right.
Duration: 60 Minutes
Cost: Free
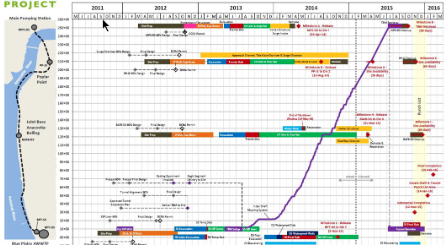
Your project’s schedule contains 2,638 activities and prints 61 pages of Gantt charts. How are you going to review this schedule and communicate it to your team in a format that they can use?
Project schedules are becoming more complex and making sure you communicate the right information to the right people is important to keep your project running smoothly.
That's why I'm bringing you the expert on graphic scheduling for Construction - James Wonneberg, PE, CCM - to show you how to create linear schedules, effectively communicate your project data and more.
What You'll Learn in This Webinar
- How to create a linear schedule that illustrates your entire project on a single page, with major activities plotted by time and location.
- How to effectively communicate complex construction schedules to a wide variety of audiences.
- How this method has played a key role in delivering major infrastructure projects including the DC Clean Rivers Project in Washington DC, the Alaskan Way Viaduct Replacement in Seattle and the Regional Connector subway extension in Los Angeles.

James Wonneberg, PE, CCM
James works with multi-disciplinary teams to deliver major infrastructure projects, and frequently uses graphic scheduling as his most-valuable project management tool. By day he provides construction management support to WSDOT with McMillen Jacobs Associates, and on nights and weekends he runs a software startup called GraphicSchedule.com.

Michael Lepage
Chief Learning Officer @ Plan Academy
Michael has been a Project Controls educator for 10+ years and has taught 1000s of professionals how to use project controls software like Primavera P6 through his popular online courses, video tutorials and articles.
Michael is a member of AACE, the Guild of Project Controls and holds his PMP certification from PMI. Michael plays guitar and piano, when he's not polar diving in the Canadian wilderness. ;)
